

When Insights Come Too Late
Your CFO presents Q3 results to the board. Revenue is down 12% in Saudi operations. A director leans forward and asks the question that matters: “Why?”
The honest answer: “We’ll investigate and report back next month.”
By then, your competitors have already adjusted their strategy. Your sales team has already committed to deals at the old margins. Your procurement team has already locked in supply contracts. The moment to react has passed.
This scenario plays out weekly across Middle East enterprises—and it reveals a critical problem: Most Middle East companies have invested heavily in business intelligence (dashboards, reports, historical data) but lack the advanced analytics capabilities (predictive insights, scenario modeling, prescriptive recommendations) needed to make decisions in real time.
According to McKinsey research, GCC companies are rapidly moving toward AI integration, with 86% already using AI agents in daily workflows[1]. Yet despite this adoption momentum, many enterprises report the same frustration: drowning in dashboards but starving for insights. Different departments maintain different “versions of truth.” Teams react to yesterday’s problems instead of anticipating tomorrow’s opportunities.
The cost is significant: missed opportunities worth millions, delayed decision-making that compounds market disadvantages, strategy that remains reactive rather than proactive. As Saudi Arabia’s Vision 2030 pressure intensifies and GCC companies compete globally, this gap between data availability and decision capability has become a competitive liability.
This article explores how Middle East enterprises are moving beyond “what happened” to “what should we do”—and how advanced analytics, properly implemented, delivers measurable business outcomes in months, not years. It’s written for CFOs, business analysts, and data leaders who have BI but recognize they need more.

The BI vs. Analytics Gap: Understanding What You’re Missing
Let’s be direct: most Middle East enterprises have business intelligence. Many have invested significantly in it. But having BI and leveraging advanced analytics are fundamentally different capabilities—and the distinction matters because it determines whether you lead or follow in your market.
Dimension |
Business Intelligence (What You Likely Have) |
Advanced Analytics (What You Need) |
Business Impact |
|---|---|---|---|
|
Question Type |
What happened? |
What will happen? Why? What should we do? |
Proactive vs. reactive decisions |
|
Data Focus |
Historical, backward-looking |
Predictive, forward-looking |
Decision timing moves from weeks to days |
|
Insight Mechanism |
Dashboards showing results |
Correlation and causation analysis |
Understanding drivers of performance, not just outcomes |
|
Example |
“Revenue decreased 15% YoY” |
“Revenue decreased because Q2 had 2% fewer selling days, competitor pricing dropped 8%, and customer concentration in Oil & Gas shifted away” |
Actionable intelligence that guides strategy |
|
Scenario Planning |
Manual “what-if” in Excel |
Automated scenario modeling at scale |
Strategic planning becomes real-time instead of annual |
|
Data Integration |
Department-level views (siloed) |
Enterprise-wide pattern recognition |
Holistic optimization across functions |
Companies that use analytics are five times more likely to make faster decisions than those relying solely on BI[2]. But speed alone isn’t the value—it’s what you do with that speed.
Why the Gap Exists in Middle East Companies
The Middle East’s analytics maturity gap has specific causes:
Legacy system architecture: Many Middle East enterprises built their IT infrastructure over decades, with disconnected ERP systems, regional accounting practices, and department-specific databases that don’t communicate. Consolidating this data for advanced analytics requires both technical and organizational change.
BI implemented piecemeal: Finance bought a reporting tool. Sales deployed a separate dashboard. Operations implemented another platform. The result: BI provides local optimization (finance sees its data, sales sees its data) but no enterprise intelligence.
Compliance reporting as the primary use case: For years, the main driver for data systems was regulatory reporting (statutory accounts, tax compliance, zakat requirements). These use cases don’t require predictive capability—they require accurate historical data. As a result, organizational skills and systems were built around “telling the story of what happened,” not “predicting what will happen.”
Data science talent scarcity: Until recently, the region didn’t have a deep bench of data scientists and advanced analytics professionals. This is changing—Saudi Arabia’s National Strategy for Data and AI targets training 20,000 AI specialists by 2030[3]—but it meant organizations had limited ability to build advanced analytics capabilities in-house.
Cultural decision-making patterns: Historically, many Middle East business decisions were relationship-based and experience-driven (“this is what we’ve always done successfully”). While intuition remains valuable, the increasing complexity of regional and international markets demands data-backed decision-making. Organizations are shifting to this model, but it requires building new skills and changing decision-making culture.
The consequence: Companies are looking in the rearview mirror while driving forward. By the time the historical data shows a problem, market conditions have often changed. The question “why?” gets answered next month, after market opportunities have shifted.
Making It Tangible: Real Use Cases Across Middle East Operations
Theory matters, but results matter more. Here’s how Middle East enterprises are using advanced analytics to drive measurable business outcomes.
Use Case #1: Predictive Cash Flow Management (CFO Pain Point)
The Business Problem
A UAE distributor with operations across the GCC operates in a challenging cash environment. Revenue growth looks healthy on paper, but cash consistently runs short—leading to expensive emergency financing, delayed supplier payments that damage relationships, and missed early-payment discounts that represent real money left on the table.
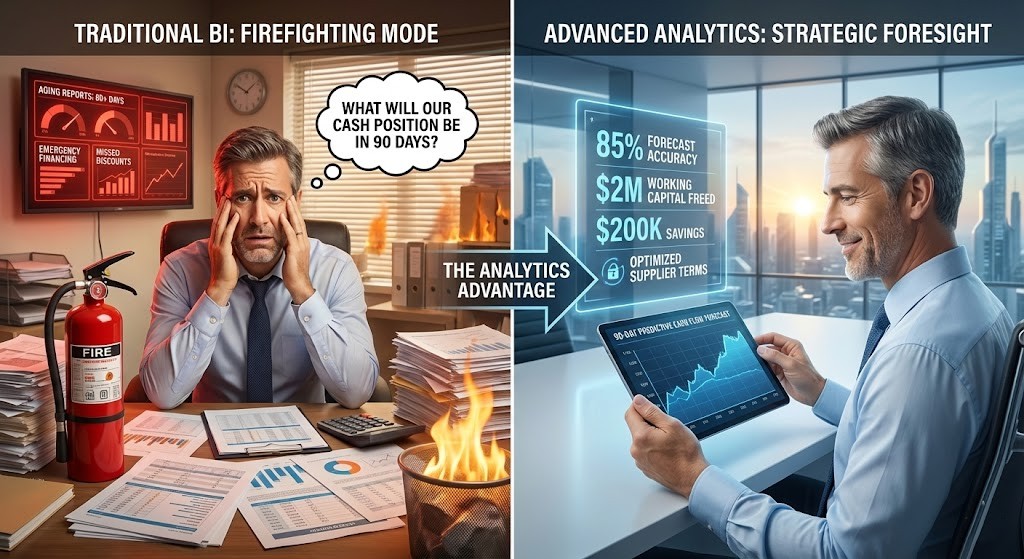
The CFO cannot predict when cash crises will hit, which means the finance team is always in firefighting mode rather than strategic mode.
Why Traditional BI Doesn’t Solve This
Standard BI systems show the CFO what’s outstanding today: – Aging reports (invoices outstanding 0-30 days, 30-60 days, 60+ days) – Month-end cash position (what happened last month) – Excel projections built manually (time-consuming, often wrong, outdated quickly)
But these tools can’t answer the critical question: “What will our cash position be 90 days from now?”
In the Middle East context, this is especially complex because: – Multi-currency receivables (AED, SAR, QAR, USD) with varying collection cycles – 60-90 day payment terms are standard in the region – Post-dated cheques (PDCs) are common—will they actually clear on date? – Seasonal variations (Ramadan often brings cash collection delays) – Different customer segments have different payment reliability patterns
The Advanced Analytics Approach
Machine learning models analyze 3+ years of payment history to predict which invoices will be paid on time, late, or default. The model factors in: – Historical payment timing by customer segment – Currency-specific collection patterns – Seasonal trends – External economic factors affecting payment behavior – Post-dated cheque historical clearance rates
The result: A 90-day cash flow forecast that updates daily as new transactions enter the system, with 85% forecast accuracy[4].
The analytics platform also simulates scenarios: “What if we tighten payment terms with slow-paying customers? What happens to cash flow in Q2 if Ramadan collections slip by 10 days? Which suppliers should we prioritize for early-pay discounts when cash is strong?”
Business Outcome (Actual Impact in Similar Organizations)
- CFO visibility: 90-day cash forecast delivered on mobile dashboard every morning, with confidence intervals
- Proactive financing: Finance arranges funding BEFORE shortage hits, avoiding 2-3% emergency borrowing premiums
- Working capital optimization: Identifies chronic late payers → Sales adjusts terms or requires prepayment → $2M working capital freed up
- Supplier relationships: Finance now takes advantage of early-pay discounts when cash is forecast to be strong → $200K annual interest cost savings
- Decision speed: Month-end cash analysis moved from 3 days of manual work to automated daily dashboard
This is possible today with SAP Analytics Cloud (for predictive modeling) and SAP S/4HANA (for transaction data) working together.
Use Case #2: Margin Optimization in Retail (Business Analyst Pain Point)
The Business Problem
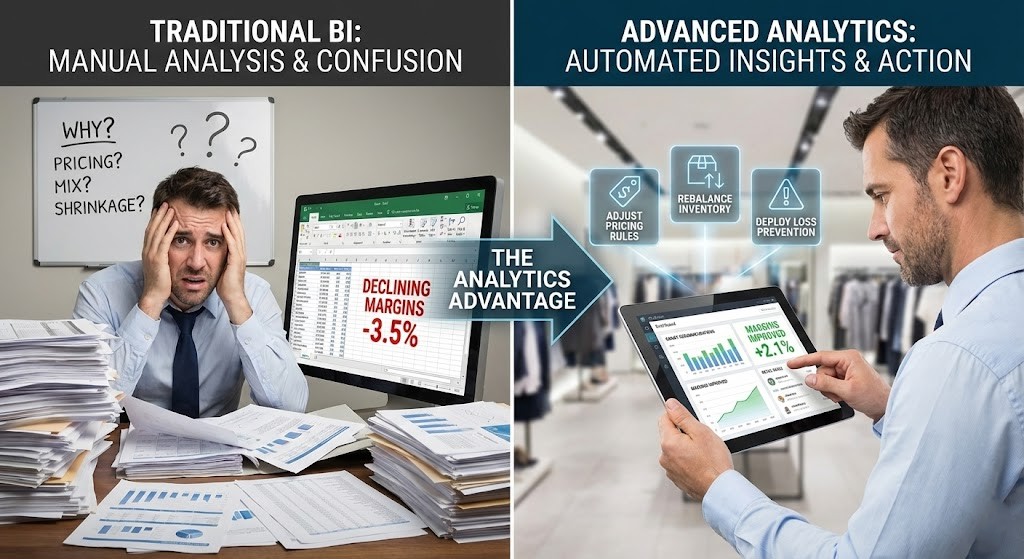
A GCC retail chain with 50 stores across UAE and Saudi Arabia has declining margins—down 3.5% year-over-year. Management knows margins are eroding but can’t identify why. Is it product mix? Pricing decisions? Regional differences? Staff discounting abuse? Rising supplier costs? Inventory shrinkage?
The business analyst spends 2 weeks each month analyzing data in Excel, searching for patterns. By the time the analysis is complete, the data is already outdated. And even after 2 weeks of effort, the answer is often “it’s a combination of factors”—not specific enough to drive action.
Why Traditional BI Falls Short
- BI provides the problem statement: - Overall margin dashboard (down 3.5% YoY) - Sales by product category - Cost reports by location
- But it doesn’t explain the problem. Manual analysis follows, consuming weeks and yielding incomplete insights.
The Advanced Analytics Approach
Advanced analytics analyzes millions of transaction records across all 50 stores to identify margin drivers. Using unsupervised learning and pattern recognition, it discovers:
- Product-level insight: High-margin products are being discounted too aggressively in Saudi stores (revenue-focused sales team sacrificing margin)
- Location-specific insight: Dubai stores ordering wrong product mix (too much low-margin items, not enough premium products that drive traffic)
- Operational insight: Shrinkage (theft/waste) is 2.5% of inventory in two specific stores vs. 0.5% chain average
- Supplier insight: Exchange rate fluctuations are eroding margins on key imported goods more than recognized
Smart Recommendations Generated by the System
- Adjust pricing rules: Don’t discount high-margin items as aggressively; implement bundle strategies that protect margin while maintaining competitiveness
- Rebalance inventory by location: Shift product mix toward higher-margin items in Dubai
- Deploy loss prevention: Focus anti-theft efforts on high-shrinkage stores
- Hedge currency: Lock in exchange rates on key imports that drive margins
Business Outcome
- Implemented top 3 recommendations over 6 months
- Margins improved 2.1% (partially offsetting the 3.5% decline), with further improvements tracking
- For a $200M revenue retail chain: 2.1% = $4.2M bottom-line impact
- Analysis that previously took 2 weeks now updates daily
- Retail manager at each store receives location-specific margin insights automatically
- Identifies best practices from top-performing stores for replication across network
Use Case #3: Predictive Maintenance for Oil & Gas Operations (Operations Pain Point)
The Business Problem
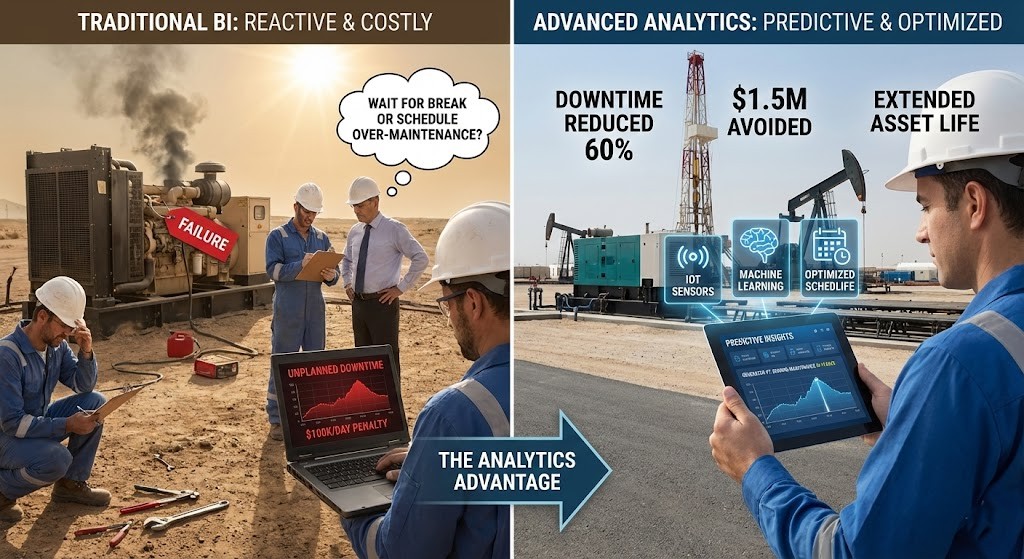
A Saudi EPC contractor operates expensive equipment on megaprojects—cranes, generators, specialized fabrication equipment, temporary camps. Unplanned downtime costs $50K-$100K per day in project penalties, equipment rental, and labor inefficiency.
Maintenance approach is either reactive (wait for failure, then fix it) or scheduled (perform maintenance on a calendar, often on things that don’t actually need it yet). Both are wasteful. Reactive maintenance creates emergency costs and project delays. Scheduled maintenance wastes resources and shortens equipment life through over-maintenance.
Why Traditional BI Can’t Help
- BI systems might track: - Maintenance history by equipment - Equipment downtime incidents - Cost of maintenance activities
- But they don’t predict what will fail and when, leaving operations stuck with reactive or over-conservative maintenance.
The Advanced Analytics Approach
IoT sensors deployed on critical equipment continuously transmit vibration, temperature, pressure, and operational data to cloud infrastructure. Machine learning models trained on equipment failure patterns recognize signature conditions that precede failures.
The system predicts: “Generator #7 will likely experience bearing failure in 14-21 days based on current vibration patterns. Recommend replacement of bearing assembly during planned Q2 maintenance window.”
This moves maintenance from “when it breaks” or “per schedule” to “when it’s needed, at a convenient time.”
Business Outcome
- Downtime reduction: 60% reduction in unplanned downtime
- Project impact: Avoided penalties worth $1.5M annually
- Equipment life: Extended asset lifespan by 20% (no over-maintenance)
- Safety: Prevented catastrophic failures that could cause worker injury
- Cost optimization: Maintenance cost reduced 15% through efficient planning
For a contractor with multiple high-value projects, this translates to competitive advantage—the ability to deliver projects on schedule and on budget where others face delays.

How Advanced Analytics Actually Works: Demystifying the Process
At this point, you might be thinking: “This sounds great, but how does it actually work? What’s the technology? What does implementation look like?”
The good news: Modern advanced analytics platforms have become significantly more user-friendly than they were five years ago. Here’s the process broken down into digestible steps.
Step 1: Data Foundation (Connect, Don’t Move)
Advanced analytics starts with data integration—bringing together all the sources that contain relevant information: – ERP data (transactions, master data, financials) – CRM data (customer interactions, sales history) – Operations data (production logs, equipment sensors, supply chain events) – External data (economic indicators, competitor pricing, weather forecasts, market data) – Legacy system data (if needed for historical context)
Key principle: Modern platforms connect to data where it lives rather than requiring you to move it to a data warehouse. This is critical because: – Eliminates massive migration projects – Keeps data closer to real-time (no batch processes) – Simplifies data governance (single version of truth) – Reduces infrastructure costs
In a GCC context, this is essential because you can keep Saudi data in Saudi servers, UAE data in UAE servers, while still analyzing it as a unified entity. Data residency requirements are built in from the start.
SAP BTP acts as the integration layer, connecting S/4HANA instances, legacy systems, and external data sources into a unified fabric.
Data preparation happens next: Harmonizing data quality, handling missing values, standardizing definitions. A customer might be spelled 10 different ways across systems. A transaction category called “SG&A” in one system and “Operating Expenses” in another. This work is non-glamorous but critical—analytics quality depends on data quality.
Step 2: Build Analytics Models (Four Layers of Insight)
Layer 1: Descriptive Analytics (What happened?) – Reports, dashboards, historical trends – “Revenue was $X in Q3; costs were $Y; margin was Z%” – This is traditional BI—important for operations and audit trails, but not sufficient for strategy
Layer 2: Diagnostic Analytics (Why did it happen?) – Correlation and causation analysis – Root cause identification – “Revenue was down because top customer reduced order volume by 15% due to their own inventory reduction strategy” – Requires connecting multiple data sources and statistical analysis
Layer 3: Predictive Analytics (What will happen?) – Machine learning models trained on historical patterns – Forecasting future outcomes with confidence intervals – “Based on current trends and seasonal patterns, we forecast Q4 revenue will be $X ± Y%, with 80% confidence” – Enables proactive planning rather than reactive response
Layer 4: Prescriptive Analytics (What should we do?) – Optimization algorithms that recommend actions – “Given forecast demand, current inventory, and constraint X, we recommend ordering Z units this month” – Moves from “here’s what will happen” to “here’s what to do about it”
Most organizations start with Layers 1-3 (descriptive, diagnostic, predictive). Layer 4 (prescriptive) comes later as teams gain confidence in the models.
Step 3: Operationalize Insights (Embed in Workflows, Not Separate Systems)
A critical mistake many organizations make: Building advanced analytics in a separate system that nobody uses. Analysts build beautiful models, present findings, and… nothing changes because the models aren’t integrated into how decisions are actually made.
Operationalization means embedding analytics into daily workflows:
- Sales forecasts appear in the S&OP (sales and operations planning) meeting agenda automatically, with updated predictions and confidence intervals
- Cash flow forecasts populate the CFO dashboard alongside current cash position
- Inventory alerts notify procurement when predictive models forecast risk of stockout
- Margin anomalies are automatically flagged to store managers who can investigate or implement recommendations
- Churn risk scores appear in the CRM next to each customer so sales teams can prioritize retention efforts
The platform sends alerts when action is needed, surfaces recommendations in the systems people already use, and creates feedback loops so models improve over time as predictions are measured against actual outcomes.
Step 4: Continuous Learning and Improvement
Advanced analytics isn’t a one-time project; it’s an evolving capability. As more data accumulates, prediction accuracy improves. As business conditions change, models adapt. As teams use insights and see outcomes, they learn to trust and act on them faster.
This requires: – Monitoring model accuracy (comparing predictions to actual outcomes) – Retraining models with new data quarterly or semi-annually – Gathering feedback from business users about model usefulness – Evolving recommendations based on what actions actually drove results
GCC-Specific Considerations
Several factors are unique to Middle East analytics implementations:
Multi-currency complexity: Transactions occur in AED, SAR, USD, QAR, and others. Exchange rates fluctuate. Payment terms and settlement cycles vary by currency. Advanced analytics must handle this natively—including currency hedging scenarios and timing analysis.
Multi-entity consolidation: GCC companies often operate through legal entities in different countries. Consolidated analytics require handling intercompany transactions, different fiscal years, and regulatory requirements in each jurisdiction.
Arabic language support: Reports and interfaces should support Arabic for broader organizational adoption. This isn’t just translation—it’s building Arabic-language prompts for self-service analytics.
Compliance and data residency: Saudi Arabia and UAE have data residency requirements—data must be processed in local data centers. Advanced analytics platforms must respect these boundaries.
Post-dated cheque dynamics: Unique to some Middle East markets, PDCs create a layer of complexity in cash flow forecasting—the invoice is paid on paper weeks before actual funds transfer.
Seasonal volatility: Ramadan impacts customer behavior, supply chain timing, and cash flow patterns in ways that Western models might not capture.
The Practical Roadmap: Getting Started in Four Phases
Advanced analytics isn’t all-or-nothing. Most Middle East enterprises follow a phased approach that builds capability, demonstrates value, and secures continued investment.
Phase 1: Foundation (Months 1-2)
Assessment Activities: – Identify the 2-3 business decisions that take longest to make or create the most uncertainty (cash flow forecasting, demand planning, margin analysis) – Audit current data sources and quality (Can you trust the data? Is it current? Is it consistent across systems?) – Define success metrics (What outcome would justify investment? What would ROI look like?) – Map stakeholder alignment (Does the CFO want this? Does the board see value? Is there executive sponsorship?)
Key Outputs: – High-impact use case identified (typically cash flow, demand forecasting, or margin/pricing) – Data readiness assessment – Business case with projected ROI – Executive sponsor assigned
- Investment Profile: - Mostly consulting and internal time (strategy workshops, data exploration) - No major technology purchases yet - Budget: $10-20K for consulting support
Phase 2: Pilot (Months 3-4)
Execution Activities: – Select ONE use case with clear ROI (recommend starting with cash flow forecasting—every CFO cares, data is in ERP, results are measurable) – Proof of concept with real data (build the model, test it, validate accuracy) – Involve business users (not just IT team) in model development and review – Demonstrate initial results to stakeholders
Typical Pilot Scope: – SAP Analytics Cloud license(s) for pilot team – Integration with transactional system (ERP) – 2-3 month historical data analysis – Prediction model built and tested – 3-5 scenarios modeled and documented
Investment Profile: – $30-50K for pilot (SAP Analytics Cloud licenses, consulting, infrastructure) – 20-30% of CFO/analyst team time for 2-3 months – Clear go/no-go decision point at end
- Success Criteria: - Pilot delivers insights not available from BI system - Predictions prove more accurate than current manual forecasting - Business stakeholders see clear value and request rollout
Phase 3: Scale (Months 5-12)
Assuming pilot success, Phase 3 expands to the full organization:
Expansion Activities: – Add 2-3 additional use cases based on pilot learnings (margin optimization, demand forecasting, etc.) – Train power users and analysts (people who will build and maintain models going forward) – Integrate into standard decision processes (make advanced analytics normal, not special project) – Establish governance (Who approves new models? What data quality standards must be met? How often are models refreshed?) – Build self-service capability (analysts can create reports without IT support)
- Organizational Changes: - Data literacy program (helping managers understand and trust analytics) - Decision process adjustments (S&OP, cash management, pricing reviews integrate analytics) - Skill development (hire or train data analysts if not already present)
Phase 4: Mature (Year 2 and Beyond)
Long-term Embedding: – Advanced analytics becomes default mode for major decisions – Self-service analytics enables managers to ask their own questions – Model library grows (inventory optimization, customer churn prediction, equipment failure prediction, etc.) – Continuous improvement of existing models – Integration with emerging technologies (AI, machine learning, IoT)
Investment Profile: – $30-60K annual subscription for enterprise licenses – 1-2 full-time analysts for model maintenance and development – Quarterly model refresh and accuracy monitoring – Platform upgrades and new capability adoption
- Competitive Advantage: By this stage, analytics has become a source of competitive differentiation—enabling faster decision-making, more accurate forecasting, and proactive rather than reactive strategy.
Addressing the Objections: What Senior Leadership Actually Asks
When you pitch advanced analytics to executive teams in the Middle East, certain objections come up consistently. Here’s how to address them:
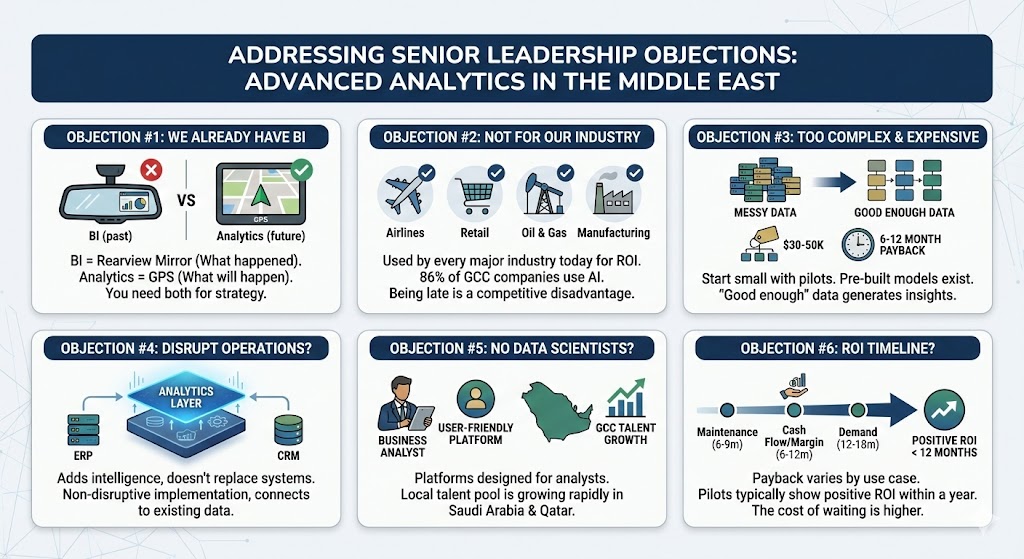
Objection #1: “We already have BI—isn’t this the same thing?”
Response: BI tells you what happened (rearview mirror). Analytics tells you what will happen and what to do (GPS navigation for your business). You need both. BI is operationally necessary—it runs the business day-to-day. Analytics is strategically necessary—it helps you anticipate and plan for change.
Think of it this way: Your monthly P&L report (BI) tells you revenue is down 12%. That’s important information, but it’s historical. Advanced analytics tells you why revenue is down and what happens if you take action X. That’s strategic.
Both are needed. Most successful organizations have both running in parallel.
Objection #2: “Advanced analytics is only for tech companies and consultants. We’re a manufacturing/retail/logistics company. This won’t work for us.”
Response: Every major airline, bank, insurance company, logistics provider, retailer, and oil company is using advanced analytics today. Not because they’re tech companies—because analytics delivers ROI in almost every industry.
Airlines use it for demand forecasting and crew optimization. Retailers use it for pricing and inventory. Oil companies use it for predictive maintenance. Manufacturers use it for quality control and demand planning. Middle East companies are adopting rapidly—86% of GCC companies now report using AI agents in their workflows[1]. Being late means competitive disadvantage.
The question isn’t whether advanced analytics is for your industry. It’s whether your competitors are doing it (and if so, can you afford not to?).
Objection #3: “This sounds complex and expensive. Our data is messy. I’m not sure we’re ready.”
Response: Every company’s data is messy initially. That’s normal. Part of any analytics implementation is data cleanup and standardization. “Perfect data” is never the prerequisite—“good enough data” to generate insights is.
On complexity and cost: Modern platforms have pre-built models that non-data-scientists can use. You don’t need a team of PhDs. A typical pilot (proof of concept) costs $30-50K and takes 2-3 months. Most companies break even within 6-12 months based on the business outcomes. For cash flow forecasting alone, a 2% improvement in interest costs pays for the whole project.
Start with one use case. Prove value. Then expand. Nobody expects you to be ready for prime time immediately.
Objection #4: “Will implementing this disrupt our current operations and systems?”
Response: Analytics sits on top of your existing systems. It doesn’t replace your ERP, CRM, or other platforms. It connects to them and adds intelligence.
Think of it as adding a layer of insight, not ripping out and replacing. Your people continue using the systems they know. You just get better data going into their decisions.
From an IT perspective, this is non-disruptive—typically low to moderate risk implementation.
Objection #5: “We don’t have data scientists and can’t hire them in the Middle East market.”
Response: Two things changed recently:
First, modern analytics platforms (like SAP Analytics Cloud) are designed for business analysts, not just data scientists. They have pre-built models and drag-and-drop interfaces. You don’t need a PhD to use them.
Second, the talent picture in the Middle East is improving. Saudi Arabia is investing heavily in data science education and training. Qatar’s AI strategy is building local talent pools. Even if you don’t have experts now, they’re becoming available. And for the initial setup, you use consulting support.
Most organizations start with a small team (business analysts + external consulting) and build out capability over time.
Objection #6: “What’s the ROI timeline? When will we see payback?”
Response: Depends on the use case: – Predictive maintenance: Fastest payback (6-9 months for high-downtime equipment) – Cash flow forecasting: 6-12 months (interest savings + working capital optimization) – Demand forecasting: 12-18 months (inventory optimization + supply chain efficiency) – Margin/pricing optimization: 6-12 months (margin improvement on large revenue base)
Overall pilot: Typically positive ROI within 12 months. Enterprise rollout can deliver 3-10x ROI annually once models are mature.
The cost of not having it: Delayed decisions, missed opportunities, reactive strategy. Middle East companies competing globally can’t afford that cost.
A Middle East Success Story: From Gut-Feel to Data-Driven
Here’s how a realistic regional scenario played out:
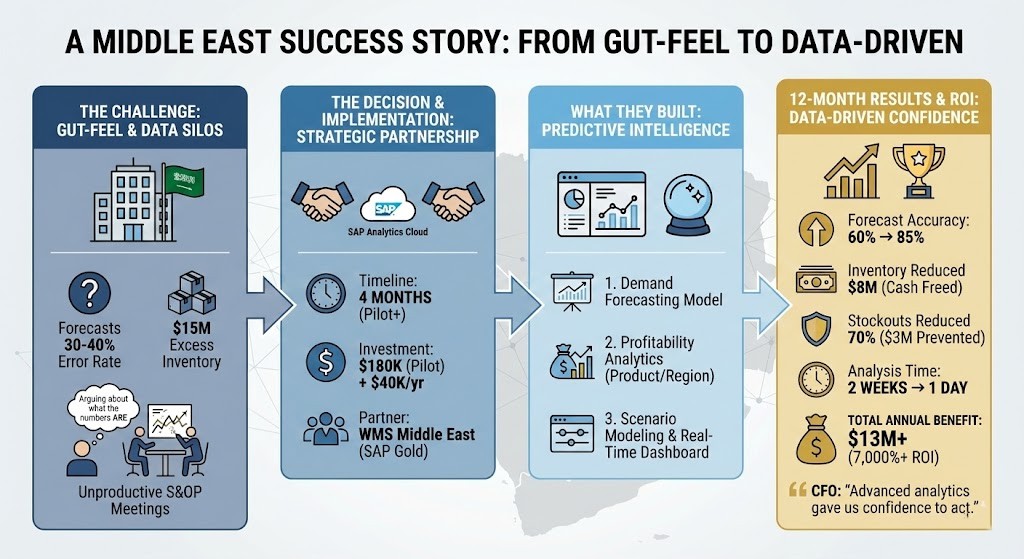
The Organization: A Saudi manufacturing group with $400M annual revenue, 2,000 employees, and operations in Saudi Arabia (3 factories) and UAE (1 facility). Core business: industrial equipment manufacturing serving construction, oil & gas, and industrial sectors. Under pressure from Vision 2030 to modernize and demonstrate capabilities globally as they bid for regional megaprojects.
The Challenge: – Sales forecasting wildly inaccurate (30-40% error rate) – Led to either excess inventory ($15M tied up) or stockouts (lost sales and delayed project deliveries) – Monthly S&OP (sales and operations planning) meetings were unproductive—data conflicts meant time was spent arguing about what the numbers were, not what to do about them – Took 2-3 weeks after month-end to analyze performance (too late to adjust production or procurement) – Could not answer board questions about profitability by product line or customer segment – Competitors winning contracts on price because they could commit to delivery dates more confidently
The Decision: The CTO (fresh hire from global tech background) proposed implementing SAP Analytics Cloud alongside their existing S/4HANA system to build predictive demand forecasting and profitability analytics.
Initial skepticism was high: “We’re a manufacturing company, not a tech company. Our processes are fine. This sounds like overkill.”
But the CFO saw the working capital problem ($15M tied up) and greenlit a proof of concept.
The Implementation: – Partner: WMS Middle East (SAP Gold Partner with deep regional experience) – Timeline: 4 months (pilot + limited rollout) – Approach: Started with demand forecasting pilot, expanded to profitability analytics once demand model proved reliable – Investment: $180K initial implementation (pilot + rollout); $40K annual subscription and support
What They Built: 1. Demand forecasting model using 5 years of sales history, incorporating seasonality, customer segment behavior, and external factors (oil prices, construction project starts, etc.) 2. Profitability analytics by product line, customer, and region 3. What-if scenario modeling for S&OP meetings (if oil prices drop 10%, here’s the impact on demand for our equipment) 4. Real-time dashboard showing forecast vs. actual, with alerts when forecast accuracy drops below threshold
12-Month Results (Post-Go-Live): – Forecast accuracy improved from 60% to 85%[4] – Inventory reduced by $8M (working capital freed up; that’s cash available for other uses or dividend) – Stockouts reduced 70% (estimated $3M in prevented lost sales and project delays) – Month-end analysis time reduced from 2 weeks of manual work to 1 day of automated analysis – S&OP meetings productive: Time previously spent arguing about numbers now spent on strategy – Product line clarity: Identified 3 product lines that appeared profitable but were actually unprofitable once overhead allocation was accurate → Discontinued or repriced those lines → $2M margin improvement – Total annual benefit: $13M+ ($8M working capital + $3M prevented lost sales + $2M margin improvement) – ROI: 7,000%+ in year 1
The CFO’s quote afterward: “We moved from arguing about what the numbers are, to discussing what to do about them. Advanced analytics didn’t just give us insights—it gave us confidence to act.”
The Bigger Picture: Regional Drivers Accelerating Analytics Adoption
Advanced analytics adoption isn’t happening in a vacuum. Several powerful regional trends are pushing Middle East enterprises toward data-driven decision-making:
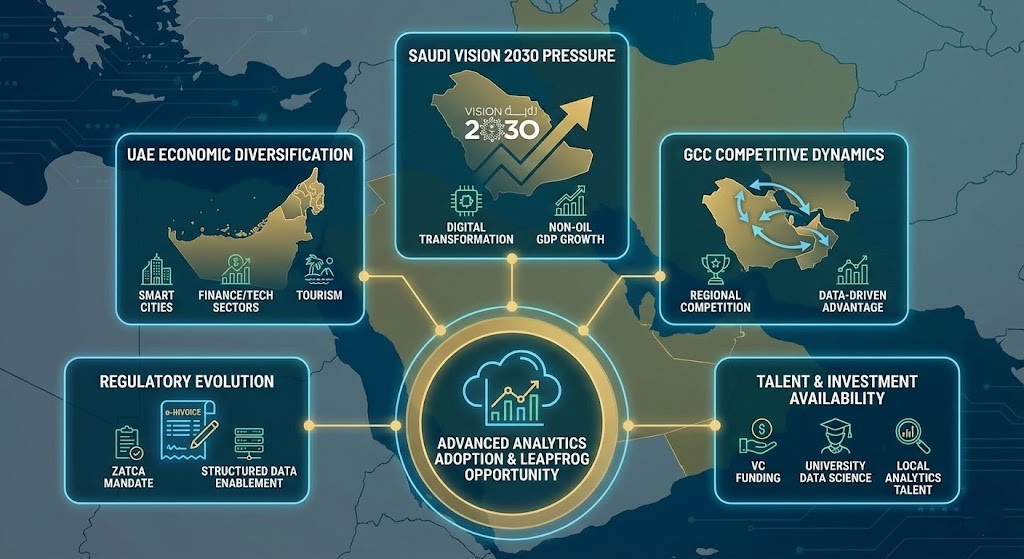
Saudi Vision 2030 Pressure
Vision 2030 is driving digital transformation at national scale. According to the 2024 Vision 2030 progress report, Saudi Arabia has jumped to 6th globally on the UN E-Government Development Index (from 52nd in 2018)[6]. Non-oil sectors now represent 51% of GDP, compared to 35% a decade ago[6].
For Saudi companies, this creates both pressure and opportunity: the government is prioritizing tech investments, regulations are evolving to support digitalization, and competitive success increasingly depends on data-driven decision-making.
The National Strategy for Data and AI aims to attract $20B in AI investments and train 20,000 data scientists by 2030[3]. This creates both talent supply and competitive pressure.
UAE Economic Diversification
The UAE is similarly pushing digital transformation—moving from oil dependence (now <5% of GDP) to finance, tourism, technology, and advanced manufacturing. Dubai 2030 vision includes smart city and smart economy initiatives that require data-driven governance and business models.
For UAE companies, this means customers and partners increasingly expect data-driven engagement. A distributor that can’t forecast demand accurately loses bids to competitors who can.
GCC Competitive Dynamics
The GCC common market is deepening regional competition. Companies from Saudi Arabia are entering UAE markets. Kuwait and Qatar companies are competing in construction and logistics. When you’re competing across borders, data-driven advantage matters—the company that forecasts customer needs accurately, manages cash flow efficiently, and optimizes operations systematically wins.
Regulatory Evolution
E-invoicing regulations (like Saudi Arabia’s ZATCA mandate) are creating rich, structured transaction data that enables new analytics possibilities. As regulatory requirements push data standardization, analytics capabilities improve naturally.
Talent and Investment Availability
For the first time, there’s meaningful venture capital and government investment flowing into Middle East data analytics and AI companies. Universities are teaching data science. Companies are hiring analysts who previously would have had to relocate to Europe or North America.
The net effect: Middle East enterprises have a unique opportunity. They don’t have 40-year-old legacy analytics infrastructure to unwind. They can leapfrog directly to modern cloud analytics platforms. Companies that do so will gain competitive advantage; those that don’t will fall behind.
Assess Your Analytics Readiness
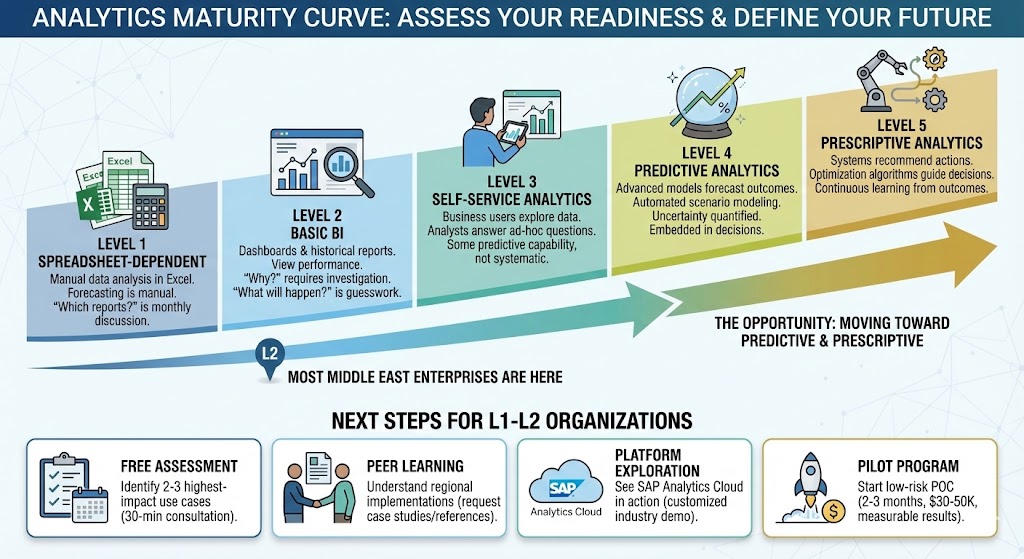
Advanced analytics isn’t an all-or-nothing decision. Most enterprises exist somewhere on an analytics maturity curve:
Level 1: Spreadsheet-dependent – Data analysis happens primarily in Excel – Forecasting and scenario modeling are manual processes – “Which reports do we need?” conversation happens each month – Examples: Small companies, some regional branches of larger companies
Level 2: Basic BI – Dashboards and historical reports are available – Stakeholders can view performance data – But “why did this happen?” requires investigation; “what will happen?” is guesswork – Examples: Most mid-market companies; common in Middle East enterprises with BI implementations but not analytics
Level 3: Self-Service Analytics – Business users can explore data and build their own reports – Analysts have tools to answer ad-hoc questions – Some predictive capability exists but isn’t systematically used in decision-making – Examples: Larger enterprises; sophisticated finance functions
Level 4: Predictive Analytics – Advanced models forecast future outcomes – Scenarios are modeled automatically – Uncertainty is quantified (80% confidence intervals, not point estimates) – Embedded in key decision processes (S&OP, cash management, pricing) – Examples: Leading companies in each industry; not yet common in Middle East but rapidly growing
Level 5: Prescriptive Analytics – Systems not only predict what will happen but recommend what to do – Optimization algorithms guide decisions – Continuous learning as outcomes are measured – Examples: Amazon, Google, leading financial institutions; frontier capability even in developed markets
Where are you today? Most Middle East enterprises are at Level 2 (BI) with some moving into Level 3 (self-service). The opportunity is moving toward Levels 4-5 (predictive and prescriptive).
Next Steps
If you’re at Level 1-2 and want to reach Level 4-5:
Free assessment: Identify your 2-3 highest-impact use cases (book a 30-minute consultation with WMS Middle East to discuss specific opportunities for your business)
Peer learning: Understand how regional companies are implementing advanced analytics (request case study examples or peer reference contacts)
Platform exploration: See SAP Analytics Cloud in action specific to your industry (request a demonstration customized to your business model)
Pilot program: Start a low-risk proof of concept on one use case (typically 2-3 months, $30-50K investment, measurable results)
The gap between BI and advanced analytics is also the gap between reactive and proactive management. Business leaders who move their organizations from “we’ll investigate and report back next month” to “here’s what we predict will happen and here’s what we recommend” gain tangible competitive advantage.
Where does your company want to be?

Summary: Your Competitive Moment
The Middle East is at an inflection point. Advanced analytics adoption is accelerating. GCC companies that build these capabilities now will gain competitive advantage. Those that delay risk falling behind.
Your BI system tells you what happened. Advanced analytics tells you what will happen and what to do. Both matter. Most Middle East enterprises today have the first without the second.
Closing the gap doesn’t require waiting for perfect conditions. It doesn’t require a team of data scientists. It doesn’t require ripping out your current systems.
It requires a decision to move from reactive to proactive management—and the willingness to invest a few months and modest resources in a pilot that demonstrates value.
For CFOs drowning in dashboards but starving for insights, for business analysts spending weeks on manual analysis, for operations leaders reacting to problems instead of predicting them—advanced analytics offers a better way.
The question isn’t whether advanced analytics will work in your organization. Leading companies across your industry are proving it does.
The question is: Will your company move fast enough to capture the advantage, or will you be following competitors who did?
Frequently Asked Questions (FAQs)
Do we need to replace our current BI tools?
No. Advanced analytics complements BI rather than replaces it. Many organizations keep existing dashboards for operational reporting and monitoring while adding advanced analytics for strategic decision-making. Both serve purposes; they’re not either/or.
How long before we see ROI?
Typical pilot delivers insights within 2-3 months. Full ROI depends on use case: cash flow optimization and predictive maintenance show results quickly (6-12 months). Culture change and broader analytics adoption takes 18-24 months.
What if our data is in multiple systems (SAP ERP, legacy systems, spreadsheets)?
Common situation. Modern analytics platforms can connect to non-SAP sources through APIs and data connectors. Data integration is typically 30-40% of implementation effort but is standard practice. Your analytics consultant will assess data availability during assessment phase.
Do we need to hire data scientists?
Not initially. Modern platforms are business-user friendly. Implementation partners help build initial models. Over time, you might hire or train data analysts, but it’s not a prerequisite to start.
What about data privacy and compliance?
SAP cloud infrastructure has UAE and Saudi data centers. Data can be configured to remain in-region if required. SAP complies with local regulations (including ZATCA in Saudi Arabia, local data protection laws in UAE, etc.). Data residency and compliance are built into the system, not added later.
Can we start with one department or must it be company-wide?
Start with one high-value use case (finance, sales, or operations). Prove value. Expand to additional use cases. Company-wide rollout comes later. This phased approach reduces risk and builds organizational confidence.
We’re planning an ERP upgrade. Should we implement analytics now or wait?
Analytics can work with current ERP. However, if ERP upgrade to S/4HANA is planned within 12-18 months, it might make sense to coordinate timing—fresh ERP data provides cleaner foundation for analytics. Discuss timing with implementation partner.
How does this work for companies with operations in multiple GCC countries?
Designed for exactly this scenario. Multi-currency, multi-entity, consolidated views are core capabilities. Actually easier than managing separate analytics per country.
What industries is this most relevant for?
Manufacturing, retail, distribution, oil & gas, and construction are most common in GCC. Applicable to any mid-to-large enterprise with complex decisions and meaningful data volumes.
What’s the typical investment?
Pilot: $30-50K (2-3 months, single use case). Full implementation: $100-250K (6-12 months, multiple use cases, company-wide). Annual subscription: $30-60K for mid-size company. ROI typically 300-1000% in year one depending on use case.

Mahitab Maher
SAP professional specializing in SAP products, helping companies turn complex processes into smooth, scalable operations.
References & Sources
[1] McKinsey GCC AI Adoption Study (November 2025) – 86% of GCC respondents use AI agents in daily workflows
[2] Advanced analytics enable companies to make decisions 5x faster than BI-only organizations (Inteliment research)
[3] Saudi Arabia’s National Strategy for Data and AI targets $20B investment and 20,000 trained specialists by 2030
[4] Predictive cash flow forecasting can achieve 85% accuracy 90-day forward using machine learning models trained on historical payment behavior
[5] Working capital optimization from improved receivables prediction: typical 2-3% improvement in cash conversion cycle
[6] Saudi Arabia Vision 2030 2024 Progress Report: Kingdom jumped to 6th place on UN E-Government Development Index; non-oil sectors now 51% of GDP


Advanced analytics is critical for competitive advantage. This article effectively explains how data-driven insights support strategic decisions.
Thank you, Thomas. Leveraging advanced analytics enables enterprises to make faster and more informed decisions. We’re glad you found the insights valuable.
Very insightful article. The way you connected enterprise strategy with SAP implementation makes the topic much clearer.
Thank you, Matthew. Aligning technology with enterprise strategy is essential for long-term success. We’re glad the perspective was helpful.
Advanced analytics is something many companies are still figuring out. Nice overview.
Thanks Omar. It’s still evolving, but the impact can be huge when done right.